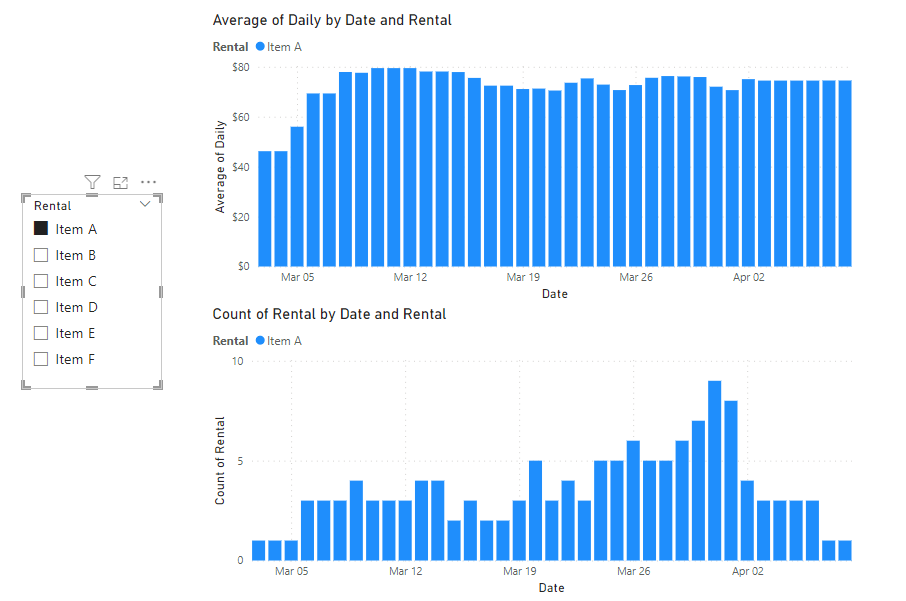
There are times when the dataset we are provided is not conducive to the questions being asked about this data. This is especially true when dealing with time series data. All to often a dataset contains date ranges. i.e. a start date and an end date, but the question being asked is something like "what is the daily trend".
The simple but inaccurate solution is to use either that start date or end date as your pivot point, but this can lead to inaccuracy in your results. So how can we take a range of dates and expand these to individual days.
Enter Data Scaffolding
According to medium.com, data scaffolding is "a technique used to fill in pieces of data that are missing from your data source in order to help with analysis and visualization".
My own definition is... a method of expanding on and inferring data based on existing data.
When analyzing time series data, it is very common to interpolate or extrapolate missing values based on the data you have available to you. In the case of date ranges, we can extrapolate each day within that range to an individual day. Math can be performed on other parameters within the dataset for an accurate result.
The Dataset
Lets imagine that a company rents random items at a daily rate. The company would like to understand some trend a cyclical information from this dataset. The data is recorded in the following format.
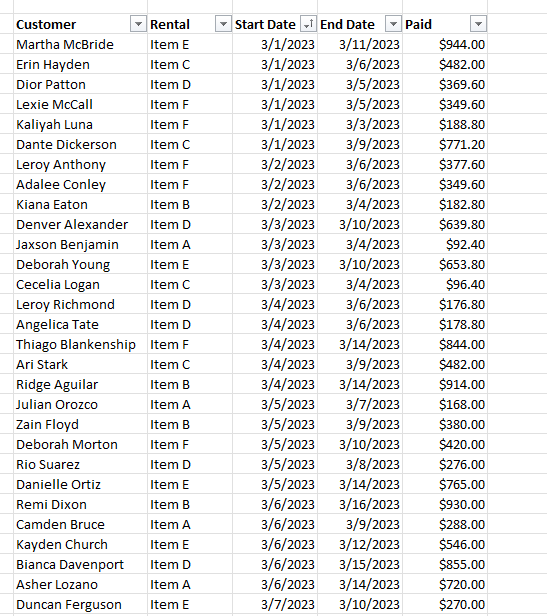
You can see that we get a customer name, the item being rented, and the amount the customer was charged. We can get a lot from this data, but understanding daily trends or cycles is extremely difficult. To better understand the trend, it is better to scaffold the data. Power Query makes short work of date scaffolding.
The Setup
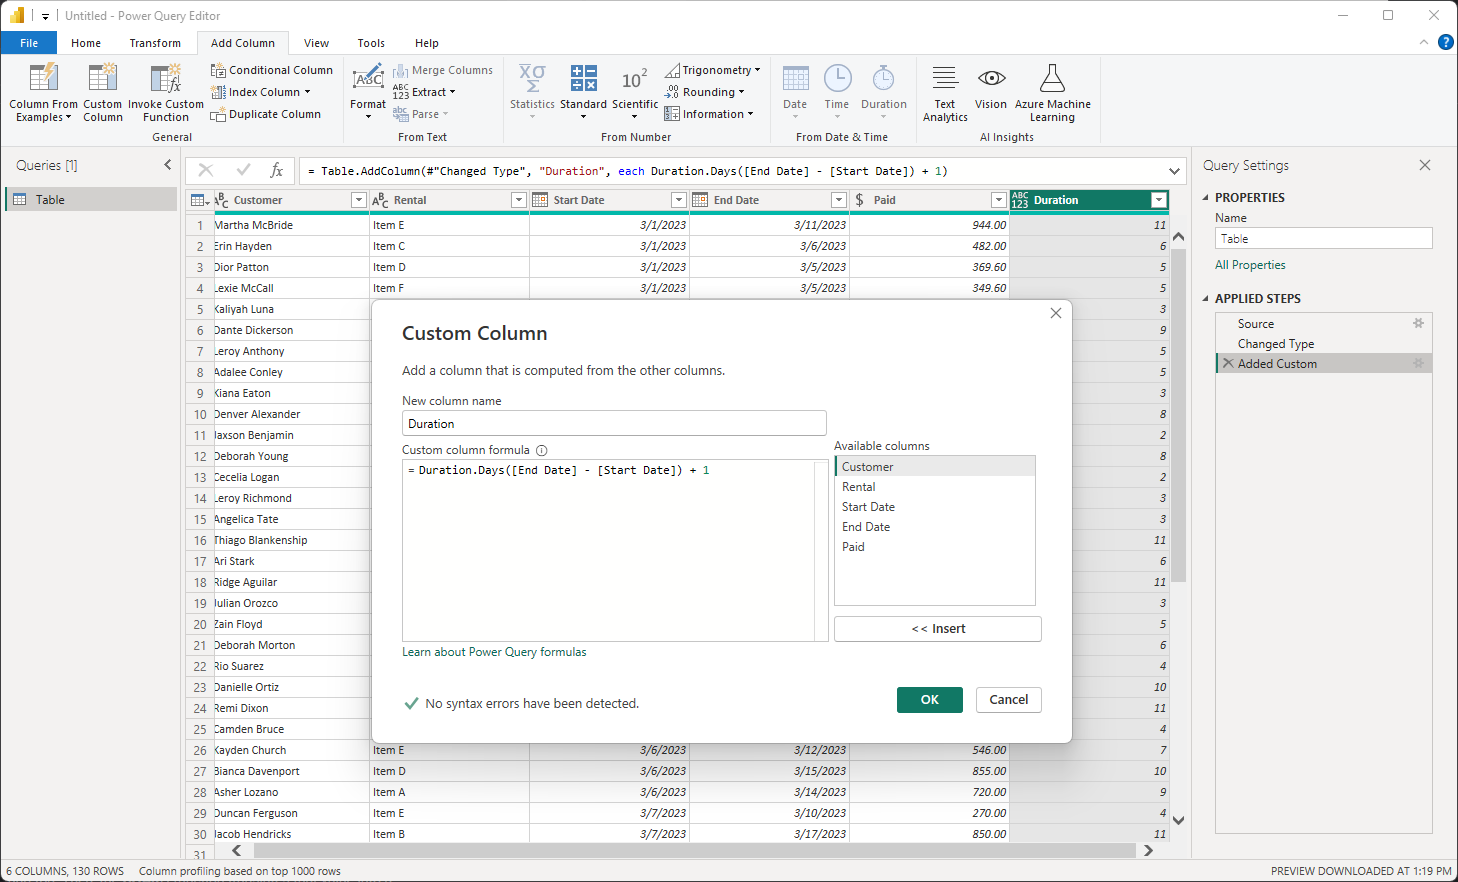
The first thing we need to do is calculate the duration. We can accomplish this with a custom column and the Duration.Days function. The + 1 ensures that we are taking into account the first day rather than calculating the days between. Always remember to set the data type of your result.
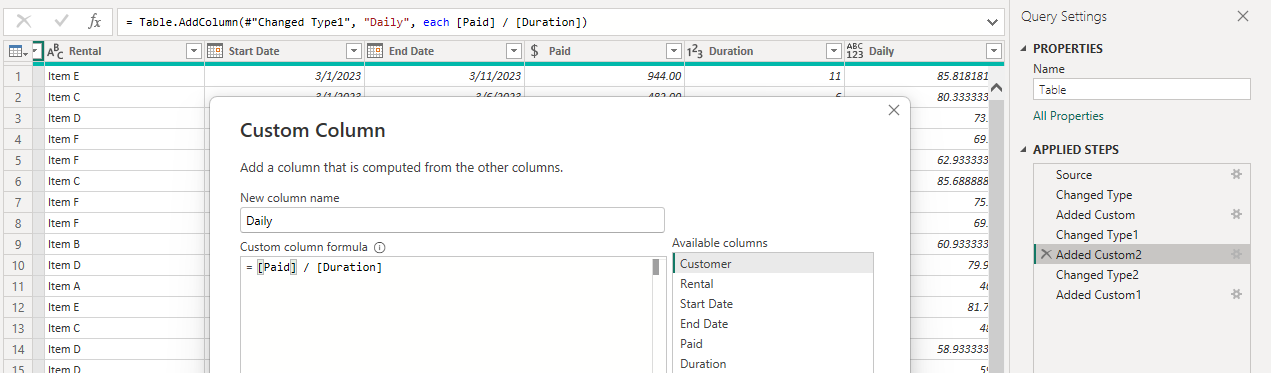
Now we need to understand what the daily rate paid for each row. We can create another new column for this. Divide the amount paid by the duration.
The last column we need is where the magic happens. We can create a column that gives us a list of dates in the date range. To do this we can use the List.Dates function. This function requires 3 inputs, the start date, the number of incremental changes (the duration in our case), and the step size.
List.Dates(start as date, count as number, step as duration) as list
The step size has a data type of duration in Power BI. According to learn.microsoft.com, a Duration data type "represents a length of time, and converts into a Decimal Number type when loaded into the model. As Decimal Number type, you can add or subtract the values from Date/Time values with correct results, and easily use the values in visualizations that show magnitude."
A duration data type can be represented in formulas as #duration(x,x,x,x), with the x representing days, hours, minutes, seconds, respectively as integers. In our case we want the date list to increment by 1 day for each step so our duration would be #duration(1,0,0,0).
Our final formula looks like
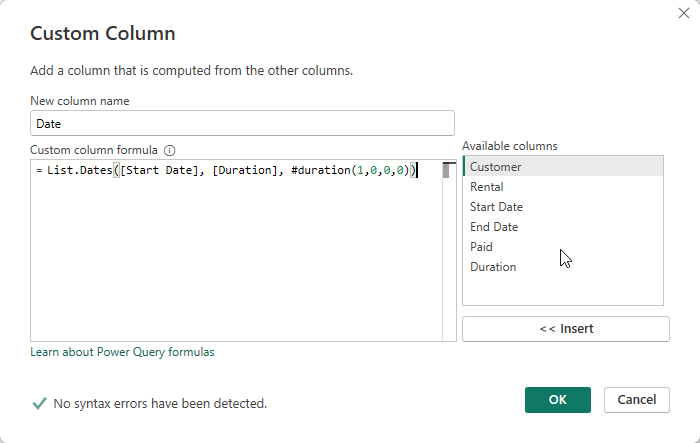
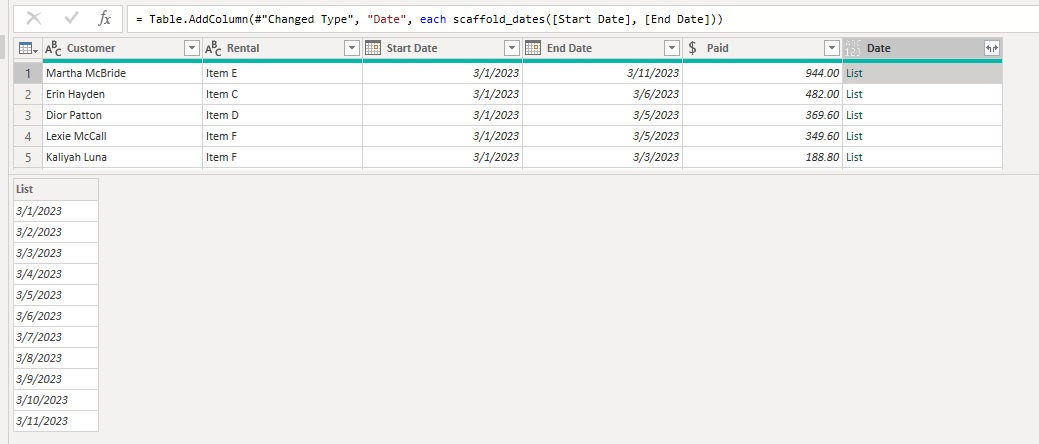
This creates a new column with a list object. If we select on of the list objects, you can see that the date range in the list starts with the first date of each row, and ends with the end date of each row.
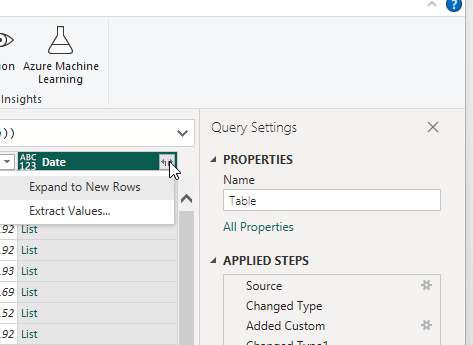
We can expand this list creating a new row for each date in the list.
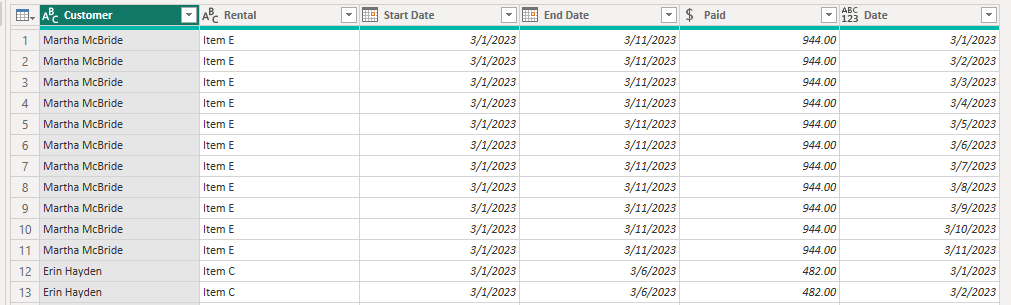
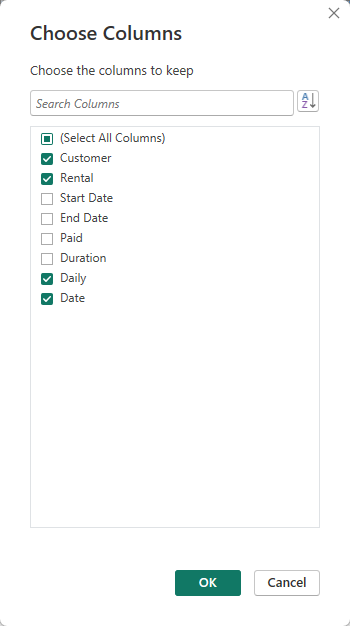
Before applying this query, we need to do some cleanup. The original start/end dates, paid, and duration are no longer needed. We can remove these columns.
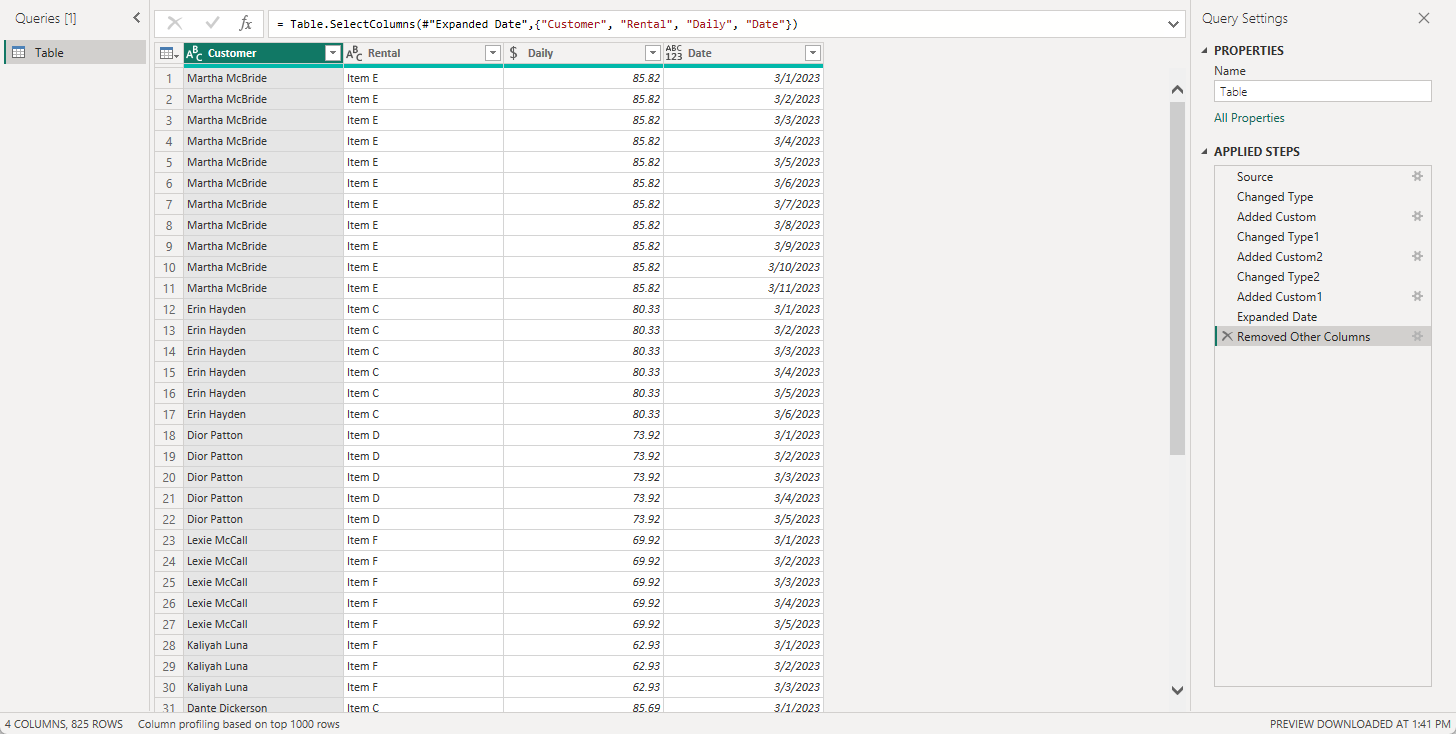
Our final dataset looks like this. Make sure to set the data type of your new column to Date.
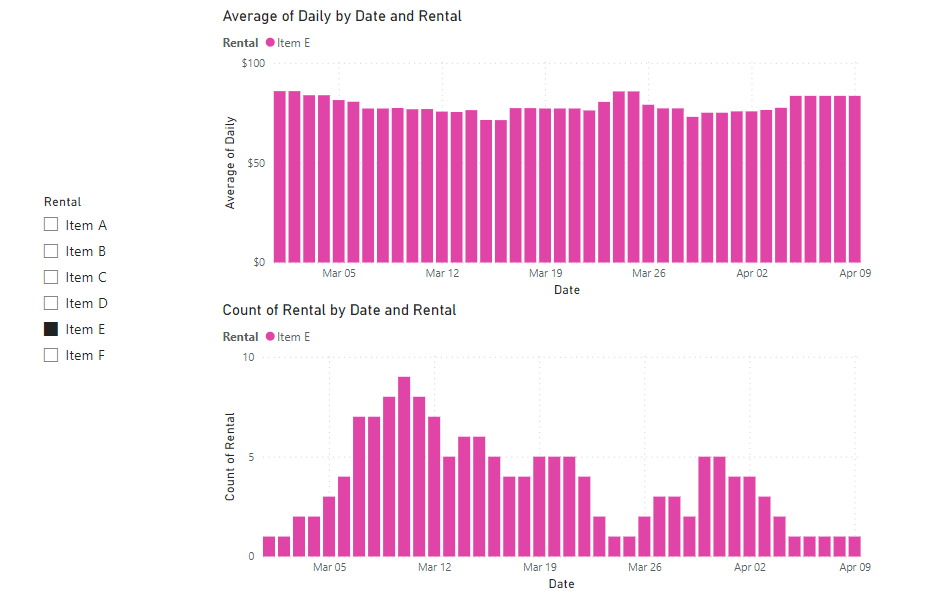
Now we can build our visualizations based on accurate daily data, and understand quite a bit more about this dataset than we originally could. How many of each item type to we need to keep in stock to account daily demand, is there a cyclical nature to to an items rental trend, etc. With a large enough dataset you can even begin to apply machine learning models to interpret seasonality and forecast revenue and product needs.
But lets take this one step further. What if I want to be able to scaffold dates faster and easier in multiple PBI files. For that, we can use a User Defined Function (UDF) in Power Query.
Creating a Date Scaffolding UDF
Lets open our Power Query editor one more time. We can see that we have a lot of steps to get to our end goal. We can crate a UDF to do most of this for us.
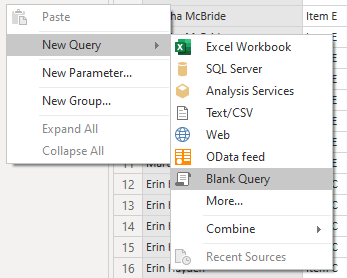
Start by creating a blank query
We can give our blank query some sample data to build off of. Open the advanced query editor and add a variable for start date and end date with sample dates. Add a third variable to calculate our duration.
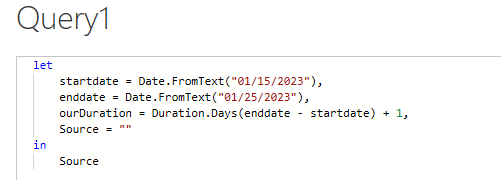
For the Source =, use the List.Dates function we used previously. It works the exact same way as before. We stipulate the start date, we give it a duration, and the incremental change we want.
Source = List.Dates(startdate, ourDuration, #duration(1,0,0,0))
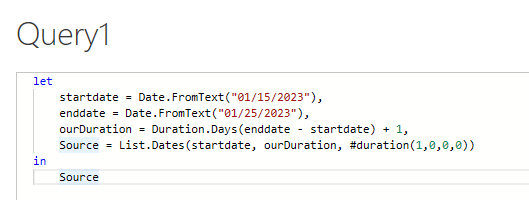
If done correctly, you can see that our output is a list of dates between our sample start and end date.
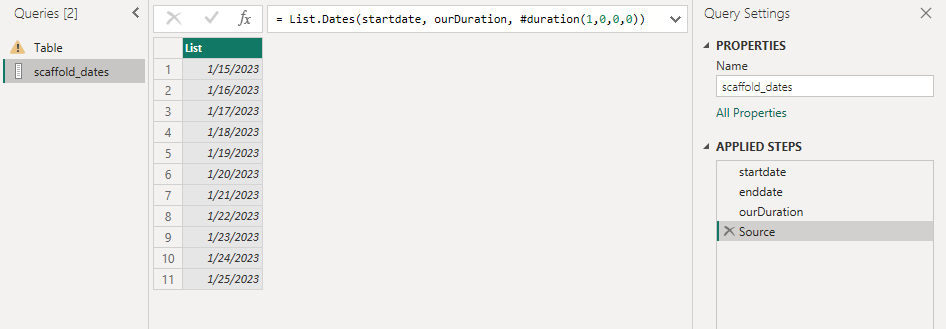
Now lets convert it to a reusable UDF. Re-open the advanced query editor and remove the sample start and end dates.
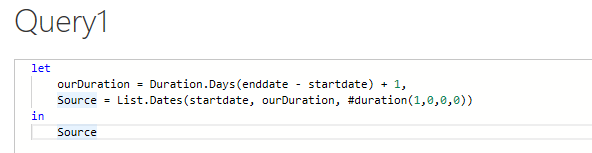
Above Let, create input parameters for startdate and enddate.
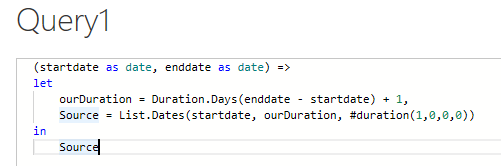
When you hit done, you will see that your new query have an Invoke option. Lets rename this function to scaffold_dates
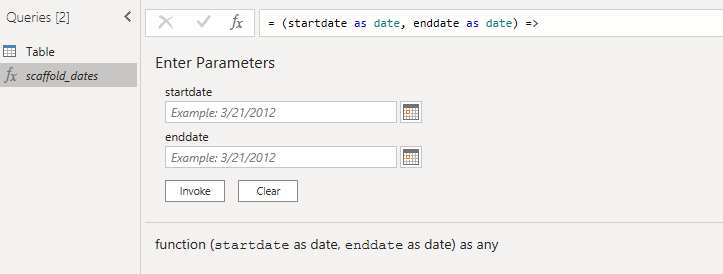
You can test this function by entering two valid dates and clicking invoke. After testing it, lets return to our original dataset, and delete all of our transformation steps up to Change Type.
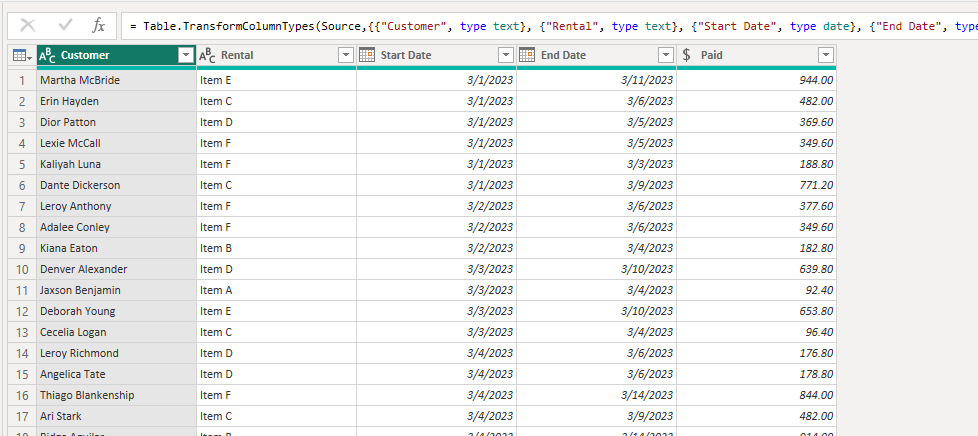
Add a custom column but this time, use our new scaffold_dates UDF
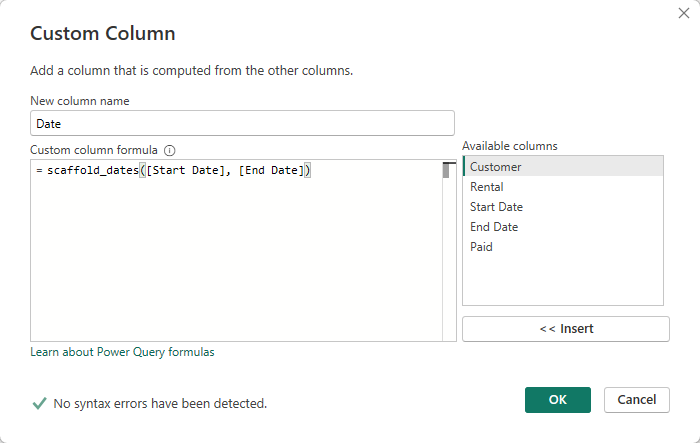
Once you click OK, you can see that you again have a list of dates for each row.
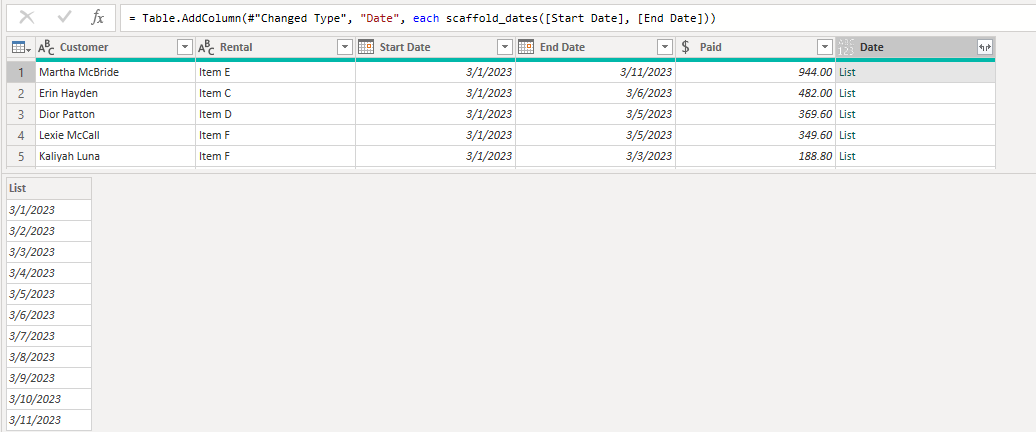
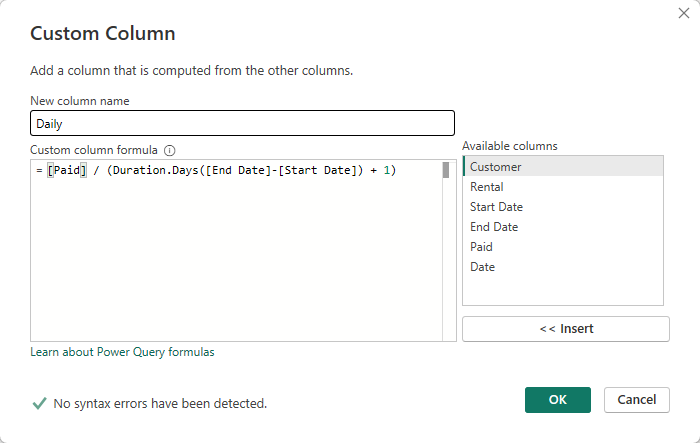
Get your daily revenue again by adding a column with the following formula. Note I added the duration calculation to this formula this time.
Remove your un-needed columns, expand the date list an voila, date scaffolding in a single step. And the best part is, you can reuse this UDF for multiple queries, or copy it into additional PBI files.
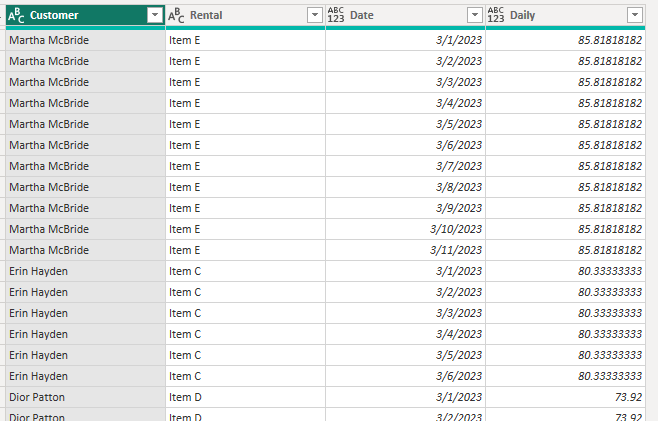
Make sure your column data types are correct, and apply.