I love using Power BI. Over the years I have used a plethora of no-code data visualization tools. Tableau, Spotfire, Thoughtspot, Plot.ly, Easy Chart Maker, the list goes on and on. In the last few years, I keep coming back to Power BI.
While Power BI may not have as many out of the box chart types or the visual esthetics of packages such as Tableau, where it truly shines is ETL. For the uninitiated in data analysis, ETL stands for Extract Transform and Load. Power BI puts the magic and Power (see what I did there) of Microsoft's stack of data transformation tools at the fingertips of coders and non-coders alike. Data workflows that used to require IT involvement to accomplish are now possible for the everyday user.
Many other data visualization packages either do not include ETL capabilities, or just give you enough of a hint of ETL to make you want, and be willing to pay more for, additional ETL software (looking at you Tableau). With Power BI you do not have this issue. Power BI gives you everything you could need to reshape your data to the exact format you need. Can you tell I'm a PBI fanboy yet?
Before we delve into the wonder and magic of using Power BI, I need to explain that there are two products called Power BI. The first is called Power BI Desktop, the second is Power BI Pro. Power BI Pro is a subscription-based data analysis and dashboard collaboration tool available from Microsoft.
Power BI Desktop is just a design environment for the Power BI Pro service however, it can be freely used without the need for a $10 subscription to the Pro service. Yes, you read that correctly, Power BI Desktop can be used for personal use for completely FREE. That is exactly how we will be using it here.
The Main Issue
My biggest gripe about Power BI is due to what it actually is. Power BI is a Dashboard design tool. It assumes that you are building a reusable dashboard that will be connected to the same data source forever. That means that there is no easy capacity to point to different data sources ad hoc. This can be accomplished, it's just not as simple as I would like.
In our basic scenario, I am connecting to a CSV file, I run my analysis and build my charts but the next day I have a whole new CSV file with updated data. My options for Power BI are to overwrite the original CSV file, to write ETL that stores the updated data to a database, or to delve into the inner workings of the ETL script I have already written in Power BI to manually change where the PBI workbook is looking for the data. What I want is a "file open" option just like in Excel.
While Power BI does not have the capacity for this built-in, it does give us most of the tools we need to build this functionality ourselves.
Using Python in Power BI
What you will need
• Power BI Desktop (2.88 at the time of writing)
• Python
Power BI allows us to use Python. For us to use Python we have to tell Power BI where our Python interpreter is installed. You can use any Python flavor you would like including a custom python virtual environment however for this demo I will be using Anaconda.
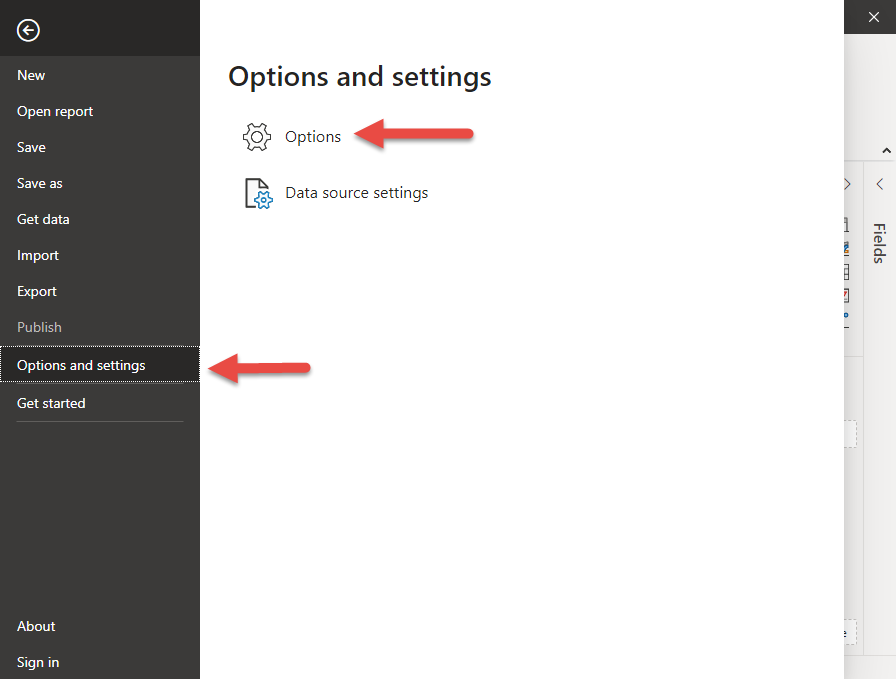
To configure Power BI to use your chosen environment, click File then Options and settings, then Options
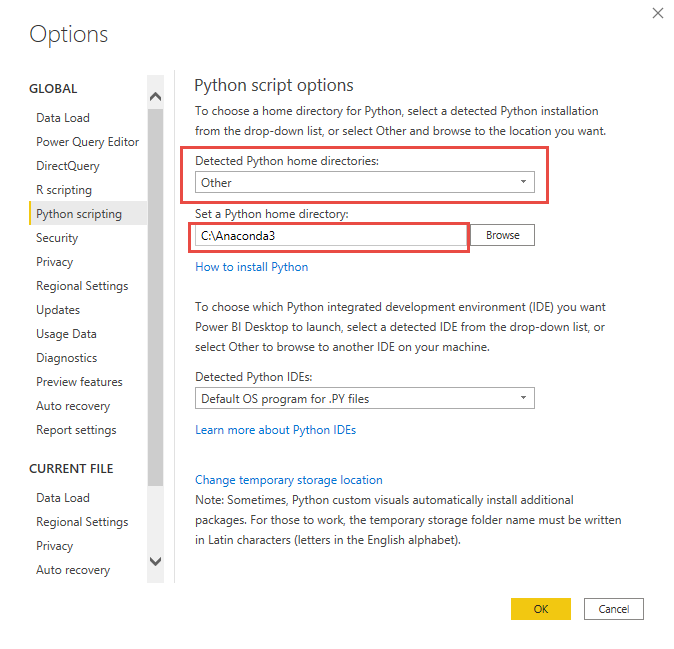
From there you can select the location of your Python environment. I currently have Anaconda installed at C:\Anaconda3. Under the Detected Python home directories either select the Python installation you intend to use or select other and provide the path to your chosen environment.
Once you have selected your Python environment, there are two ways you can use Python in Power BI. The first way you will see is a python "chart" type allowing you to embed python-based charts. At the time of writing the following Python Packages are supported for this chart type
Power BI Supported Python Packages
• matplotlib
• numpy
• pandas
• scikit-learn
• scipy
• seaborn
• statsmodels
• xgboost
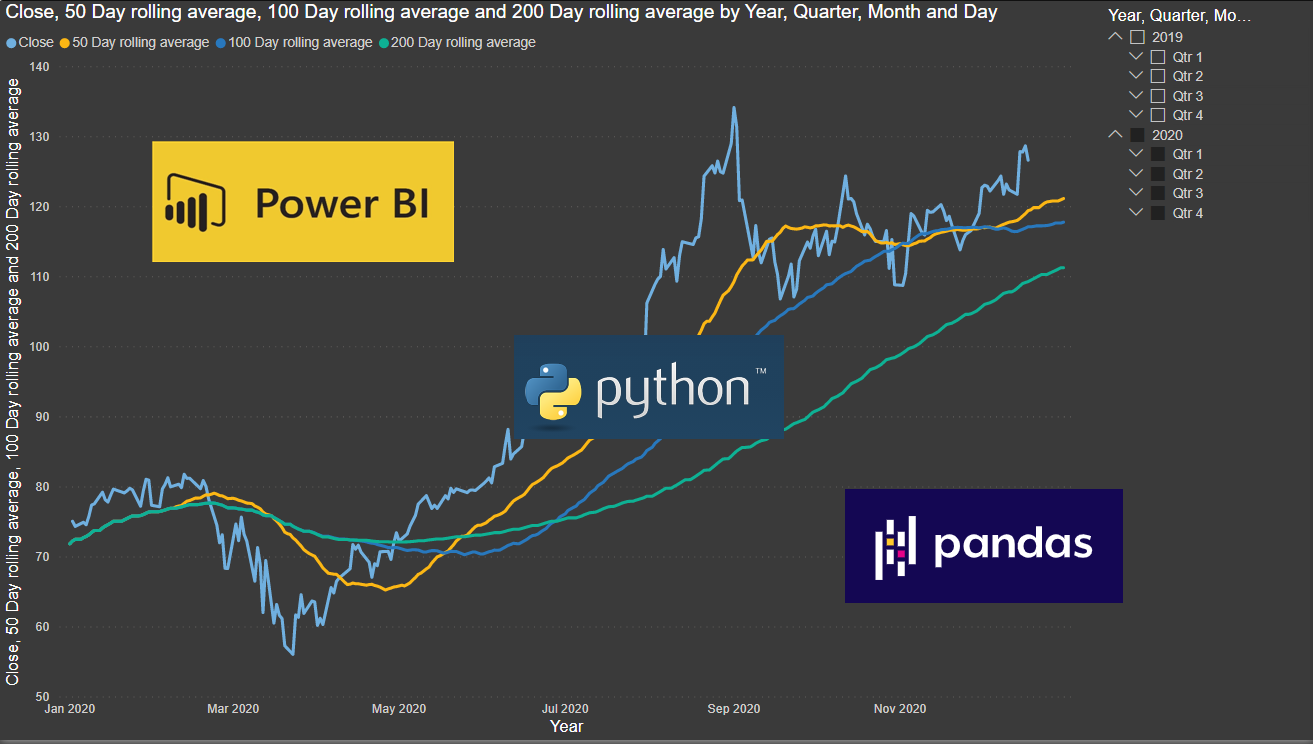
The second way to use python is in the Power Query interface in Power BI (this works in Excel also). Let's assume that we have downloaded a CSV file from Yahoo finance that contains one year's stock trade information for Microsoft. Once we have loaded this file, we spent some time creating measures for 50, 100, and 200-day moving averages, and we have also spent some time building the charts we want to view this data.
How to import data by standard methods is outside the scope of this article. As such I will assume you already know how to do this.
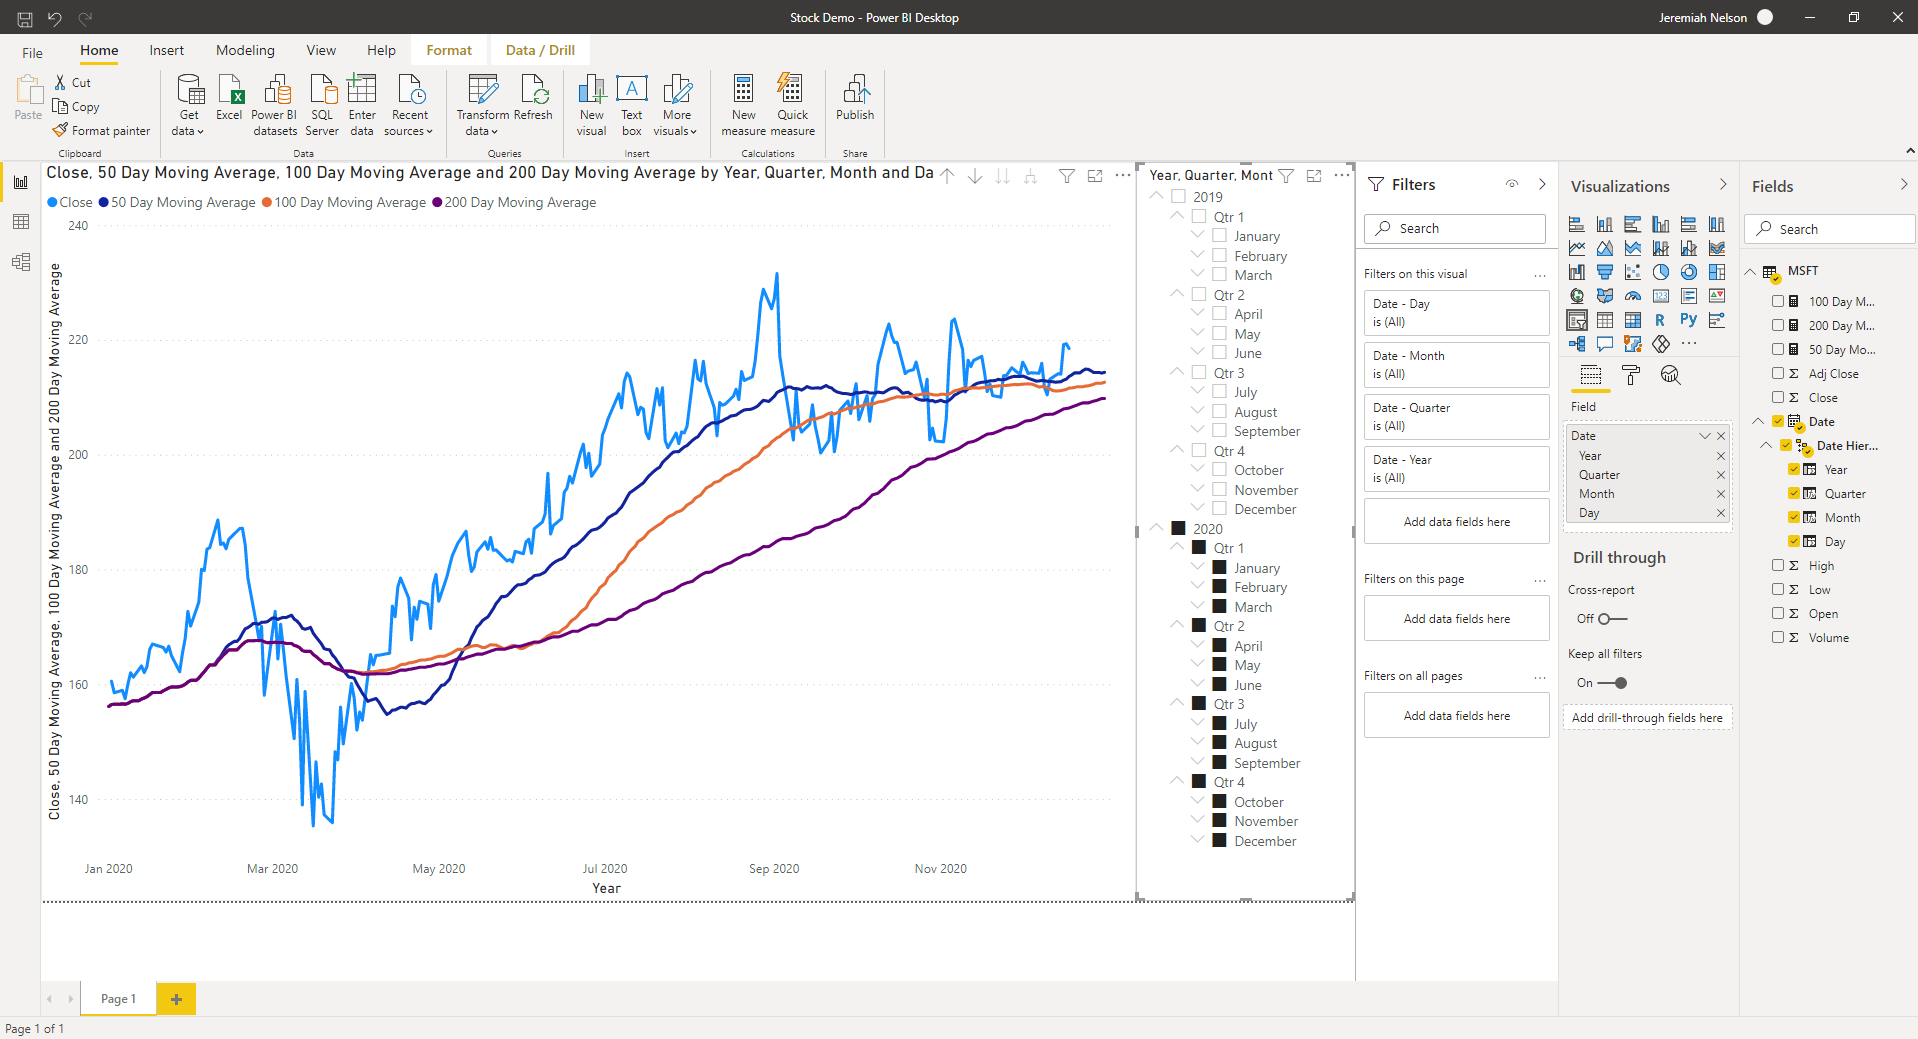
Now that we have done all of this work we want to repeat this same analysis for additional stock such as Apple. Because Power BI assumes we will always want to use the same data source forever, it buries the data source settings deep in the Power Query interface. You can click Transform Data, select the data table you wish to change, click the gear icon next to the Source entry, change the source path, then click close and apply. 5 clicks just to change a data source. If you are doing this often it will quickly become miserable.

We can simplify this significantly by using Python. Rather than using the built-in Power BI data connectors, let's write our own in Python using tkinter and pandas.
Our python script needs to
- Present a file dialog to select a csv file
- Load that csv file to a dataframe
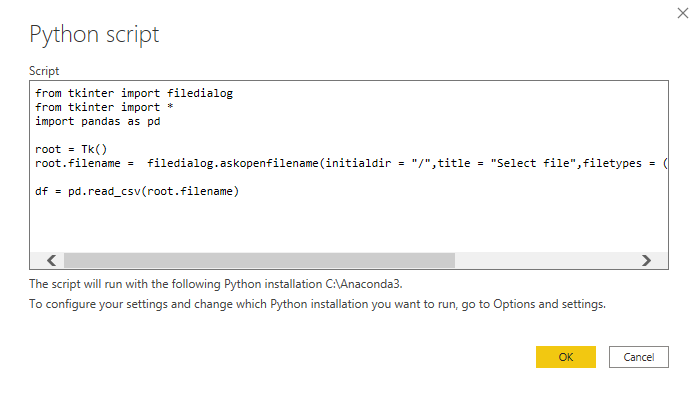
from tkinter import filedialog
from tkinter import *
import pandas as pd

root = Tk()
root.filename =  filedialog.askopenfilename(initialdir = "/",title = "Select file",filetypes = (("csv files","*.csv"),("all files","*.*")))

df = pd.read_csv(root.filename)
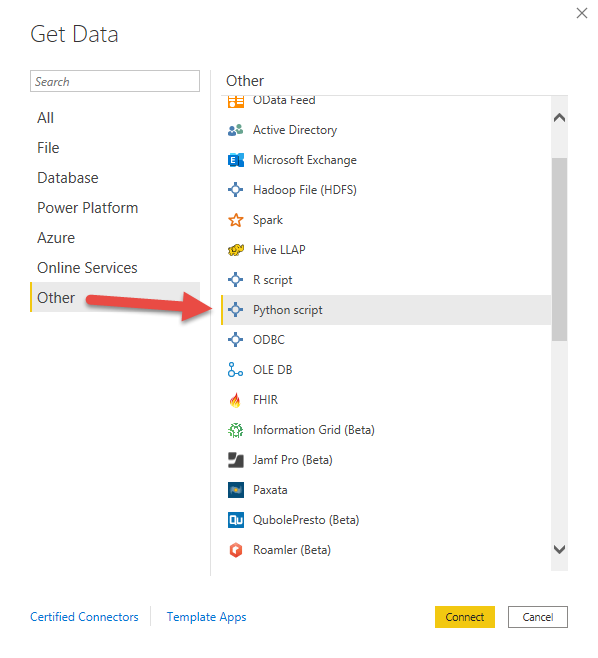
Power BI natively understands the pandas dataframe structure. Once we have our code working, we can then use it in Power BI. Open the Power Query interface by clicking Transform Data. From Power Query select New Source, then more. After the Get Data window appears, click other then Python script.
This will open the Python script window. Copy and paste our code into this window, then click OK.
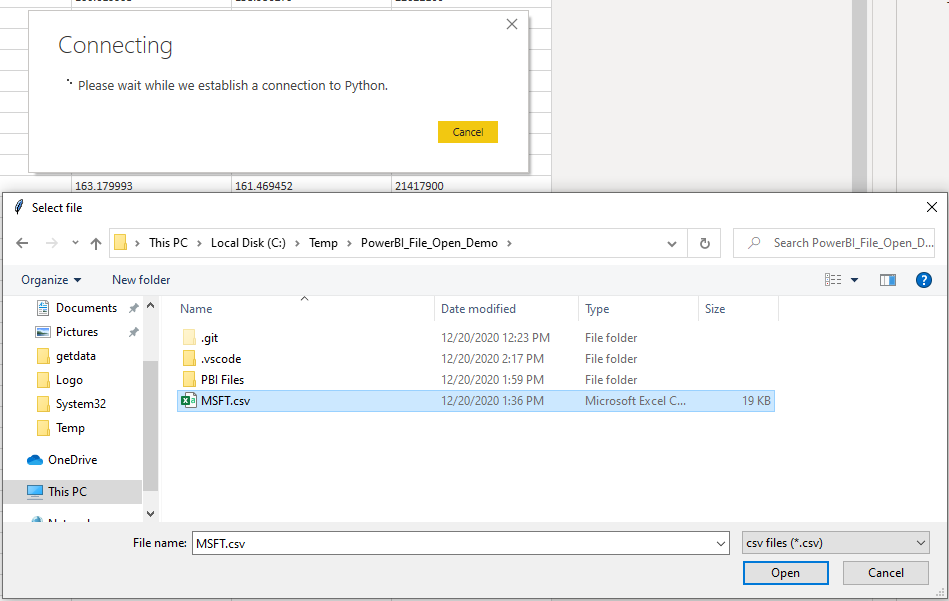
Once you click ok, it is going to run this script a few times. Just select one of your CSV files each time it asks. It will only perform this multiple times during the initial setup.
Once it has initialized the script it will give you the Navigator window. Select your dataframe then click OK.
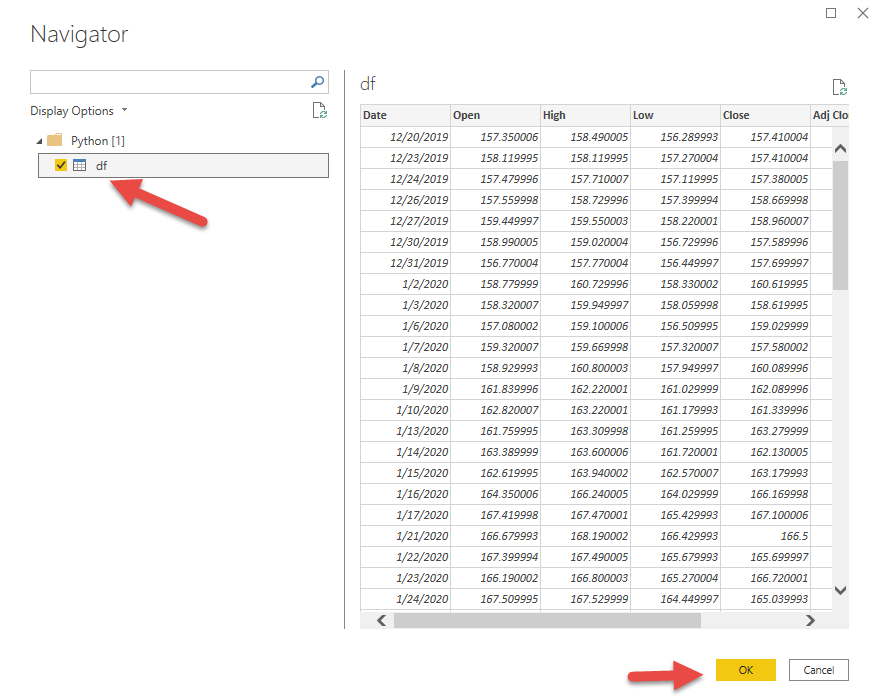
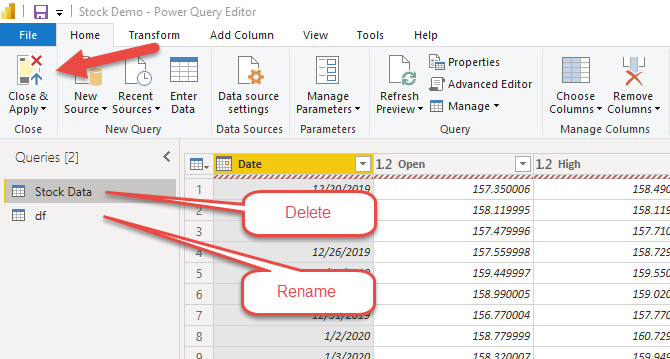
Delete the original data table we created, then rename our new python-based data table to match the original. Then click Close and Apply.
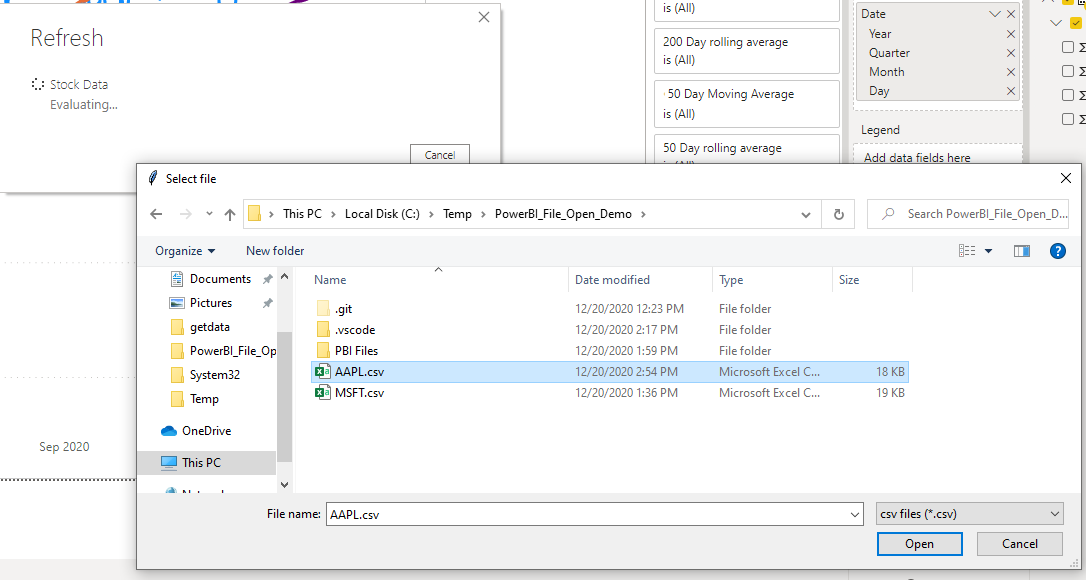
Congratulations, you are done. Any time you click the refresh button from now on, you will be presented with a tkinter file dialog allowing you to select whatever CSV file you want. As long as the CSV file contains the same data header you should not run into issues.
This is not the only use of Python for loading data. For those that use Python for data analysis on a regular basis, it quickly becomes apparent that the inclusion of Python for loading data into Power BI allows for an unlimited number of data analysis, ETL, and data science scenarios. This allows us to concentrate on the data without having to worry about chart development. Another use might be following my article Quick and Simple Stock Technical Analysis using Jupyter and ignore the chart code only using the data retrieval code.